

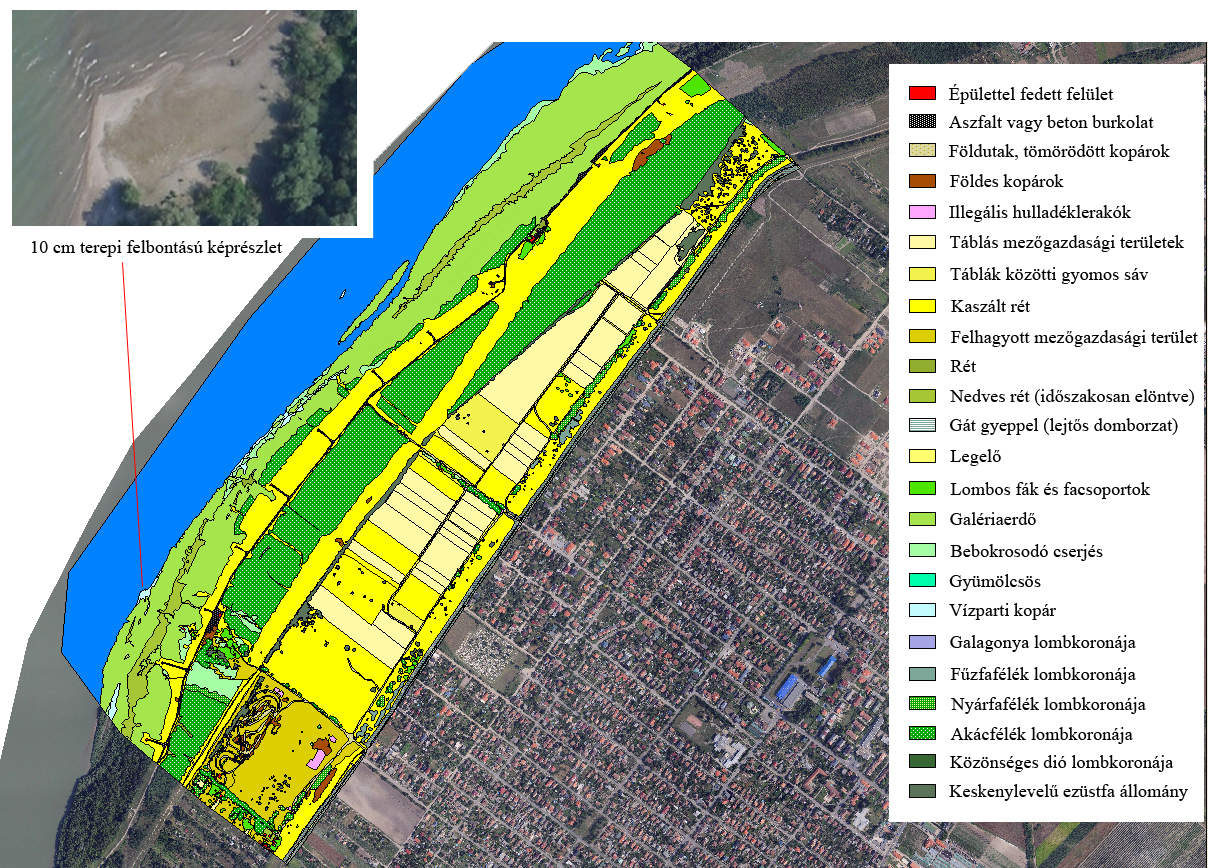
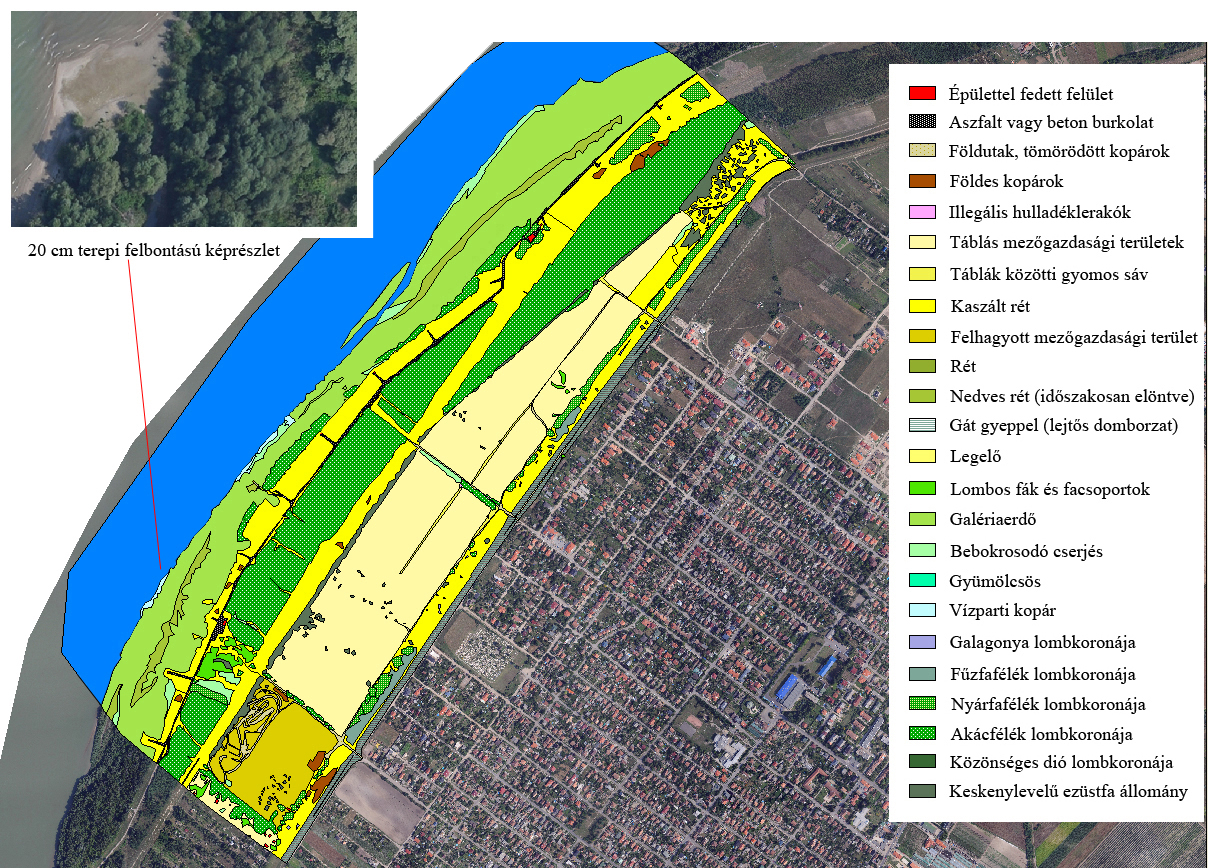
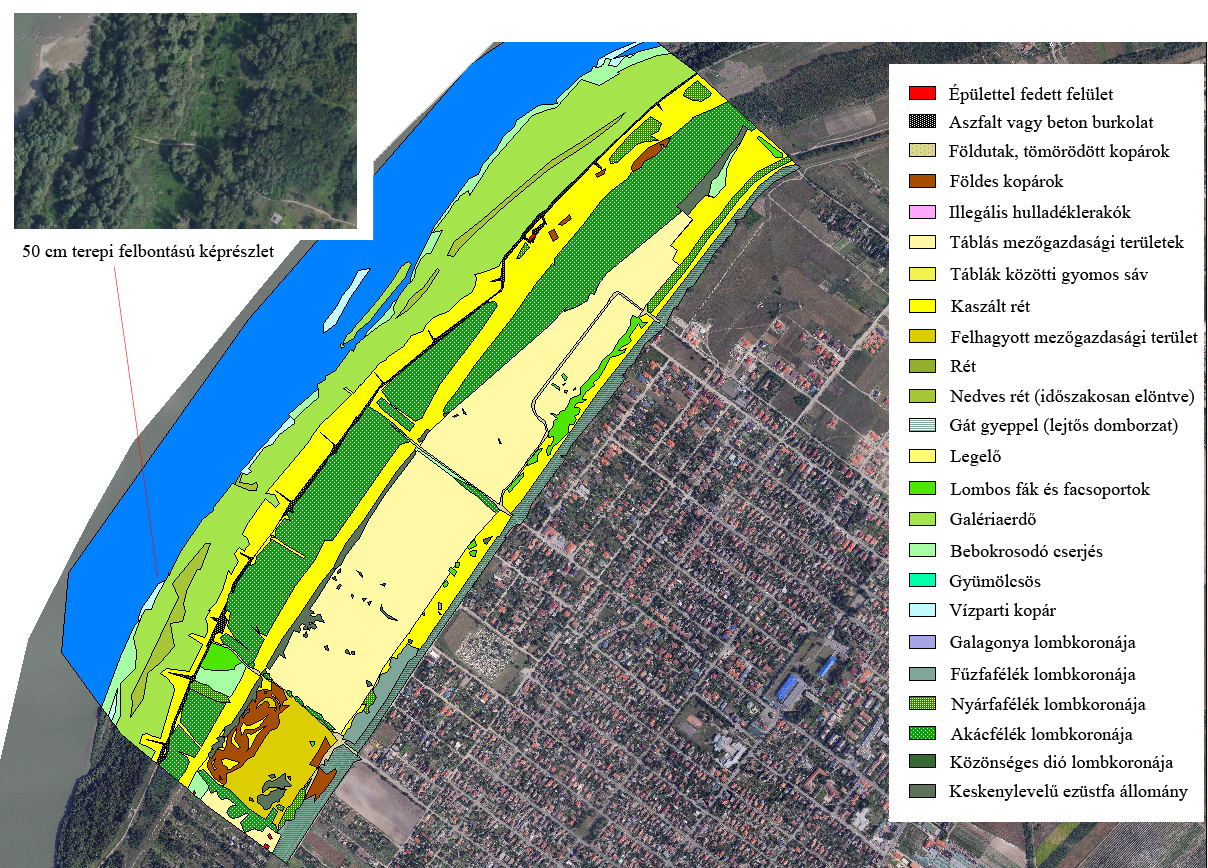
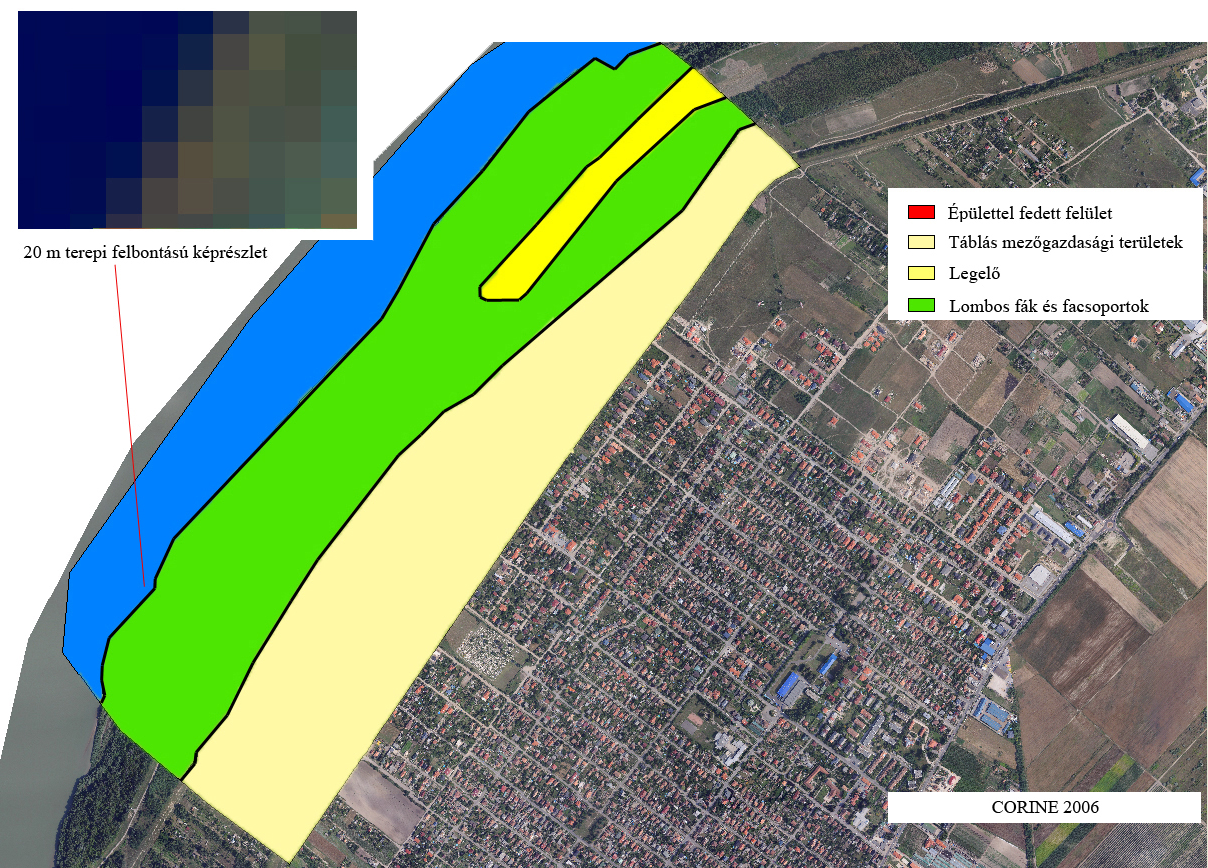
In every mapping project based on remote sensing, it is essential to determine the ground resolution that is optimal for the given purpose. Imaging parameters must be selected according to the typical size, shape, contrast, texture, abundance, and distribution of the objects to be examined, in order to find the optimum balance between quality and efficiency.
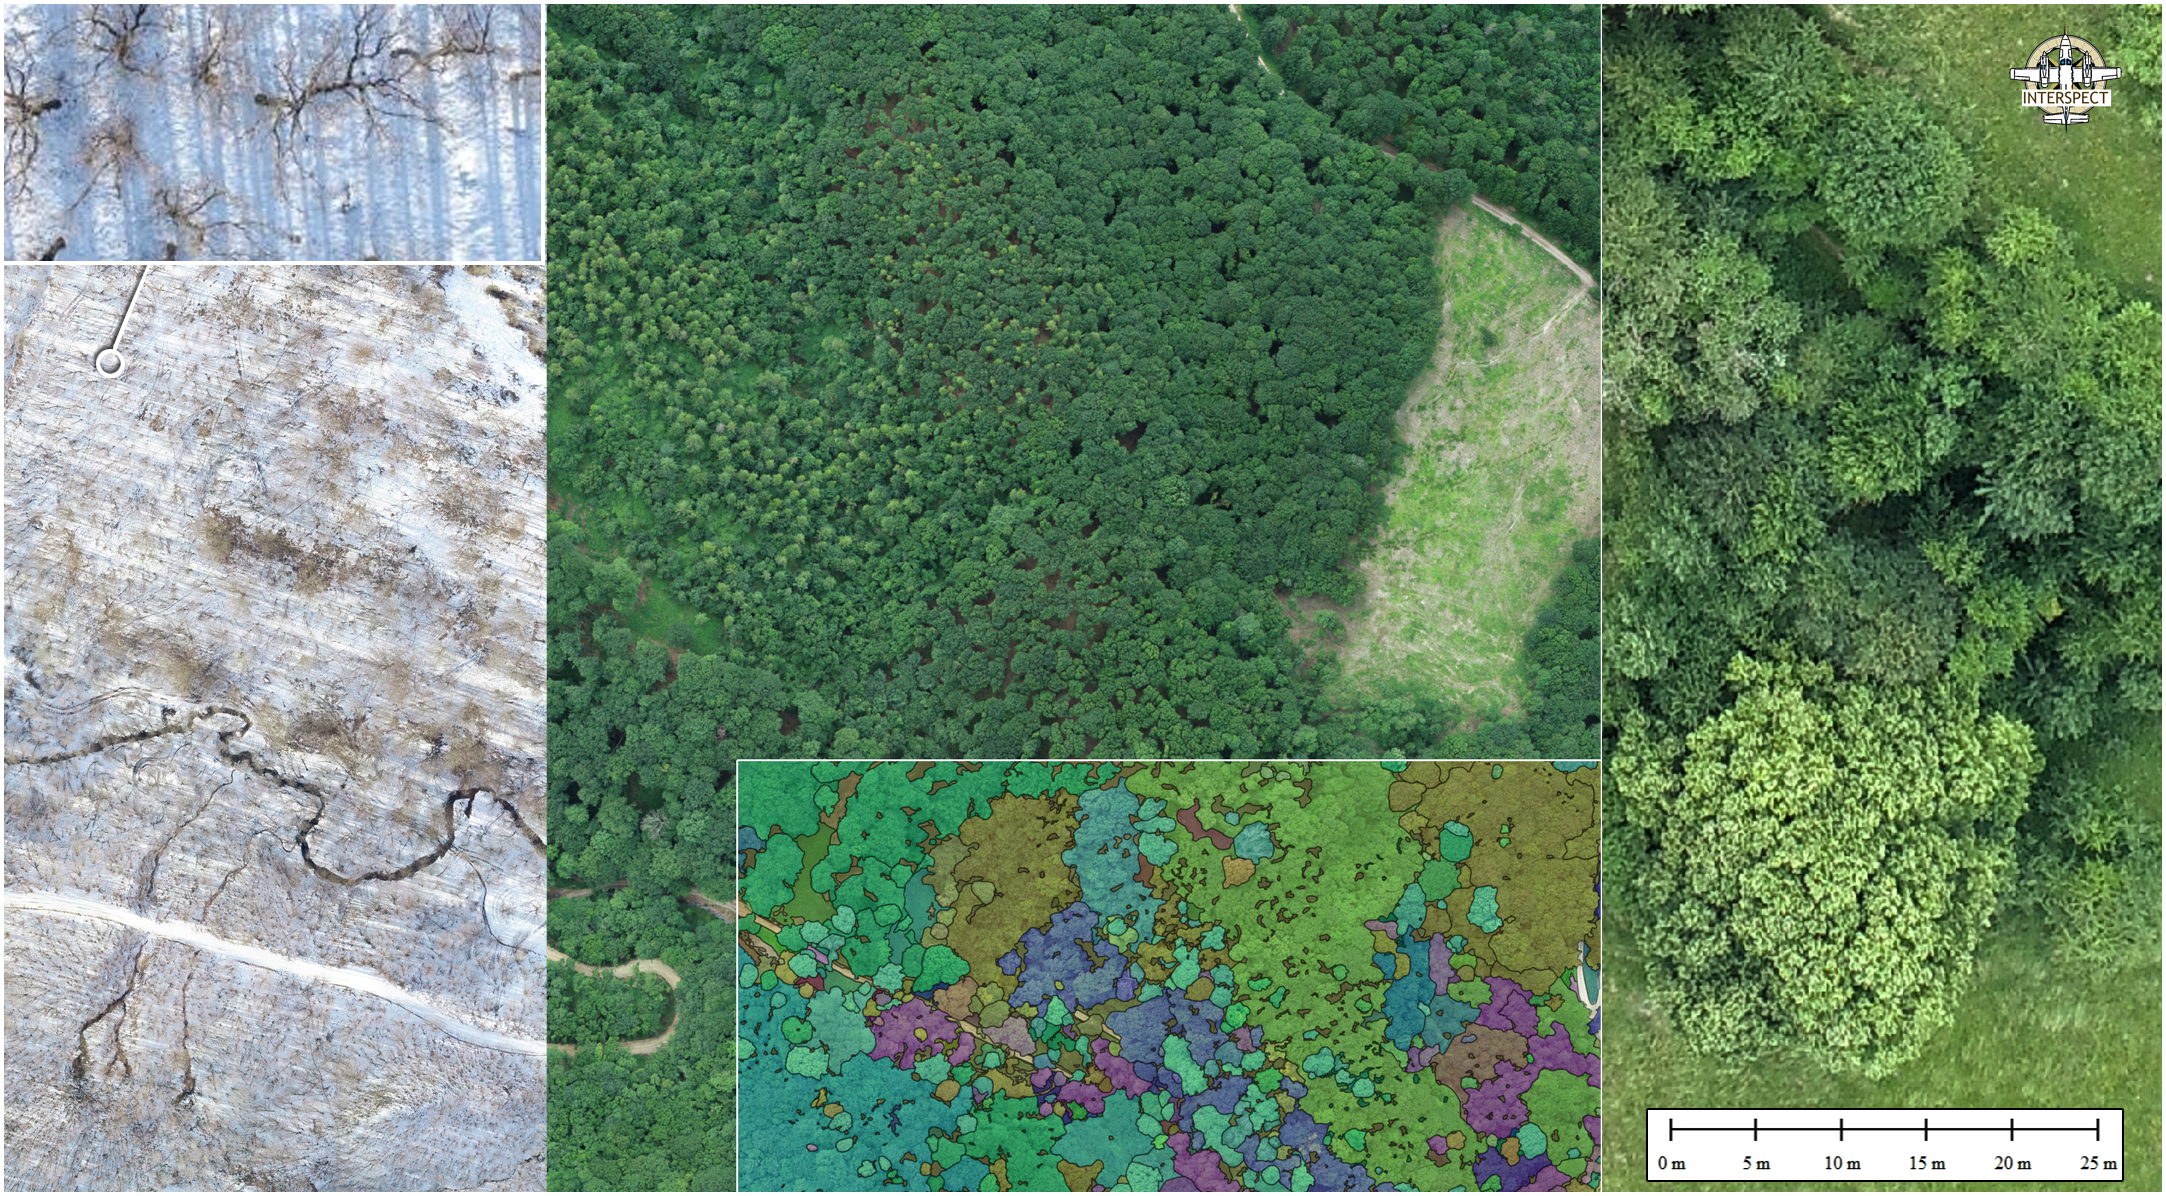
We carried out an experiment involving experts and entry-level surveyors, and the study clearly showed that increasing resolution reduces subjective bias. Because resolution fundamentally determines the accuracy of identification and analysis, the results of specialists who independently evaluated orthophoto versions of different resolutions converged as ground resolution increased (Figure 2). The study also showed a substantial reduction in patch-boundary displacement caused by shadows, a problem that is particularly significant along forest edges. The findings were later confirmed by series of machine analyses.
Details: Bakó G. 2017: Környezet- és természetvédelmi vonatkozású változások nyomon követése nagyfelbontású légi távérzékeléssel (dissertation, PDF – 22.7 MB)
The role of dynamic range, tonal range, and colour richness in aerial surveys
The bit depth that indicates the radiometric resolution of digital imagery does not by itself define the dynamic range of the image. In the analogue sense, dynamic range means how many energy levels the sensor system can distinguish within the interval between the minimum already detectable amount of energy (Lminλ) and the maximum still detectable amount of energy (Lmaxλ). However, through radiometric resolution we do not read the energy value reflected from the surface as the pixel value, but the so-called intensity value (DN) (Bakó 2012a).
For raster spatial data to be informative and rich in detail, dynamic range, tonal range, and colour richness are critically important.
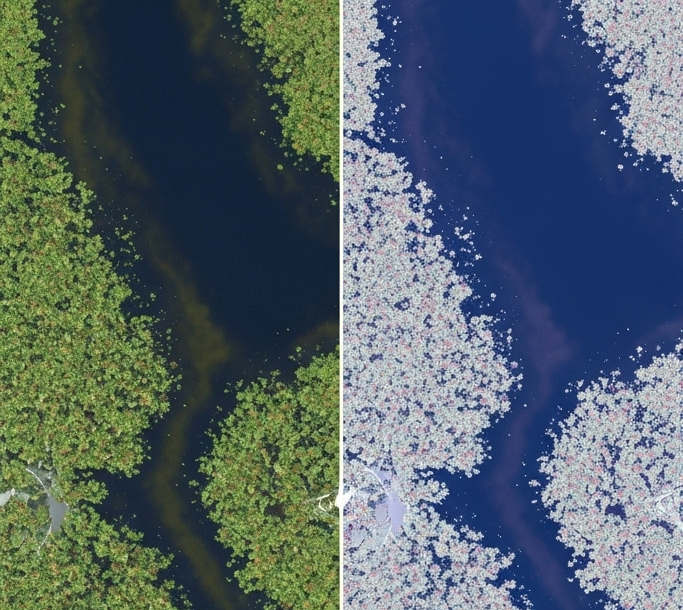
Dynamic range describes the difference between the brightest and darkest pixels: how much difference in light intensity the camera sensor can distinguish. An image with a wide dynamic range can capture details in deep shadowed areas, such as the shadow of a building, and in bright sunlit areas, such as a white roof or a glittering water surface, at the same time. In images with a weak dynamic range, dark areas would become too dark and lose information, while bright areas would burn out and also lose detail. In an orthophoto, this means that objects on the map would lose realism and useful visual information, reducing the information content.
Tonal range
Tonal range determines how many different shades or tones a digital image can display between its brightest and darkest points. In digital terms this is expressed in bits: an 8-bit image contains 28, that is 256 shades, while a 10-bit image contains 210, that is 1024. It is important to note, however, that the image formed on the sensor also has tonal range and colour richness in an analogue sense, so an increase in file size alone does not guarantee a colour-rich image that faithfully represents reality.
The greater the tonal range, the finer the transitions between light and dark areas. The image therefore becomes more lifelike, colour-accurate, detailed, and easier to analyse in both manual and machine mapping. For example, the effects caused by small light-and-shadow patterns between tree leaves can be better distinguished from properties arising from species-specific leaf texture, making identification more reliable.
Colour richness
Colour richness refers to how faithfully the image reproduces real colours, their saturation, and their shades. This applies not only to the red, green, and blue primary colours, but also to their combinations.
In an orthophoto, colour richness is critical because it enables the visual identification and distinction of different objects, such as surface types, vegetation types, and soil. Correct colours are essential for machine processing and for the automatic recognition of different objects.
These three concepts are closely related and together ensure the high quality of an orthophoto. The dynamic range handles extreme lighting conditions, the tonal range ensures fine tonal transitions, while colour richness guarantees realistic colours, making the final product an accurate and useful cartographic tool.
The importance of all this is illustrated in Figure 3.
Comparison of the dynamic range of imaging devices
The High Resolution Aerial Monitoring Network (HRAMN) is a state-of-the-art system developed primarily for the detailed and cost-effective monitoring of natural areas.
Its primary objective is large-scale monitoring of changes over time in land cover, species present in the areas, biodiversity, and other natural characteristics. It combines the advantages of high-ground-resolution aerial remote sensing with both classical and the most modern field surveys, laying the foundation for an effective environmental and nature-conservation observation network.
Prolonged human presence can potentially disturb sensitive ecosystems. HRAMN addresses this challenge by combining advanced aerial remote sensing with targeted field surveys. This approach allows conservation specialists to collect data with previously unavailable accuracy and efficiency. This emphasis is not merely a technical feature, but a strategic response to one of the fundamental challenges of nature conservation. Traditional detailed observation is often prohibitively expensive or logistically too complex, limiting the frequency and scalability of surveys.
One of the principles of the methodology is to overcome the systemic obstacles that have historically hindered comprehensive conservation efforts because of budgetary and resource constraints, thereby supporting more efficient and effective resource management.
The aerial remote-sensing phase of the surveys is carried out with piloted aircraft (for example, Piper PA-32, Cessna 182, and Cessna 210) and a wide range of unmanned aerial systems (UAS). Geometric reliability is ensured through the standardised use of direct georeferencing systems and field geodetic instruments. The versatile fleet and equipment set provides flexibility according to the survey requirements of each sample area.
The precision of HRAMN is also supported by specific examples: the horizontal accuracy of surveys carried out in lowland grasslands, marshes, and nesting sites ranges between 5.1 and 20.7 cm RMSE (root mean square error). With permanent ground control points, the geometric error can be kept below 6 cm horizontal and 8 cm vertical RMSE. The misidentification error of the upper canopy layer of trees was 5.0% based on spring RGB orthophotos, and significantly lower, 0.8%, for leaf-off orthophotos from late autumn and winter. This highlights the importance of survey timing for achieving specific monitoring objectives and supports the relevance of repeated multi-season mapping.
One of the key ethical and practical advantages of HRAMN is that it is based on non-disturbing surveys. Data collection takes place without disturbing wildlife populations, which is particularly important in protected areas and also offers many advantages at sites that are physically, legally, or from a safety perspective difficult to access.
Modern sensors can record sharp images at high speed, up to 200 km/h, from considerable altitude, 600 m, with ground resolution as fine as 0.5 cm. One pillar of the system is optimised imaging technology. During the development of the methodology, more than one hundred digital imaging systems and set combinations were tested in order to identify the optimal tools and procedures for specific monitoring tasks. From the outset, this has therefore not been an off-the-shelf technology, but a customised and refined system with a professional background. These procedures are the result of scientific and engineering work that pushes the limits of remote-sensing technology, specifically for environmental-protection and nature-conservation applications.
Surveying an entire country at such high resolution would not be practical or cost-effective. HRAMN therefore uses a spatial sampling approach that focuses on specific, representative sample areas. This enables the collection of detailed data that can then be extrapolated to larger reference zones, providing fast results and allowing seasonal surveys.
This is a pragmatic solution that balances the need for detail with costs, data volume, data storage, and processing-speed requirements.
The following remote sensing datasets are produced for the sample areas at the relevant survey dates:
- High-image-quality orthophoto mosaic with 0.4-5 cm ground resolution, in geoTIF+tfw and ECW+eww formats
- Digital surface model (DFM) with 2.5-20 cm ground resolution, in geoTIF+tfw format
- Digital terrain model (DDM) with 5-25 cm ground resolution, in geoTIF+tfw format
- Point cloud in LAS format
- Documentation aerial photographs with oblique camera axis
- Survey area boundary in Shape format
- Survey record and overview map
Evaluation of geometries derived from remote-sensing spatial data is carried out in cooperation with local experts and with the involvement of several disciplines, including botany, forestry, ecology, and geology. This interdisciplinary approach deepens our knowledge of the landscape and our understanding of the processes.
AI-supported software development and model-input generation therefore does not serve to replace human expertise, but to complement and strengthen it, accelerating modelling processes and increasing environmental safety.
The true strength of HRAMN lies in the synergistic application of cutting-edge technology and deep local human ecological knowledge, transforming raw data into interpretable conservation information suitable for decision support.
A key element of the methodology is the generation, storage structure, and optimisation of vector data for later complex analysis. A spatial object (geometry) stores information for several types of target maps. This multipurpose data storage is crucial in data analysis because data can be compared across distant areas and time series without statistical distortion, recalculation, or resampling.
Thus a single geometric entity can be interpreted in itself, while a complete, gapless map overlay covering the whole area can generate maps and analyses from different perspectives without distorting the data. A single layer stores the vegetation map, habitat-classification map, hydrological and resilience map, and ownership and land-cover maps of a given area.
Thus datasets produced for population surveys of heron colonies or for monitoring beaver impact can be used in modelling tasks related to water management, forestry, or even fire protection.
This approach ensures that the collected data can be used to the greatest possible extent in conservation decision-making.
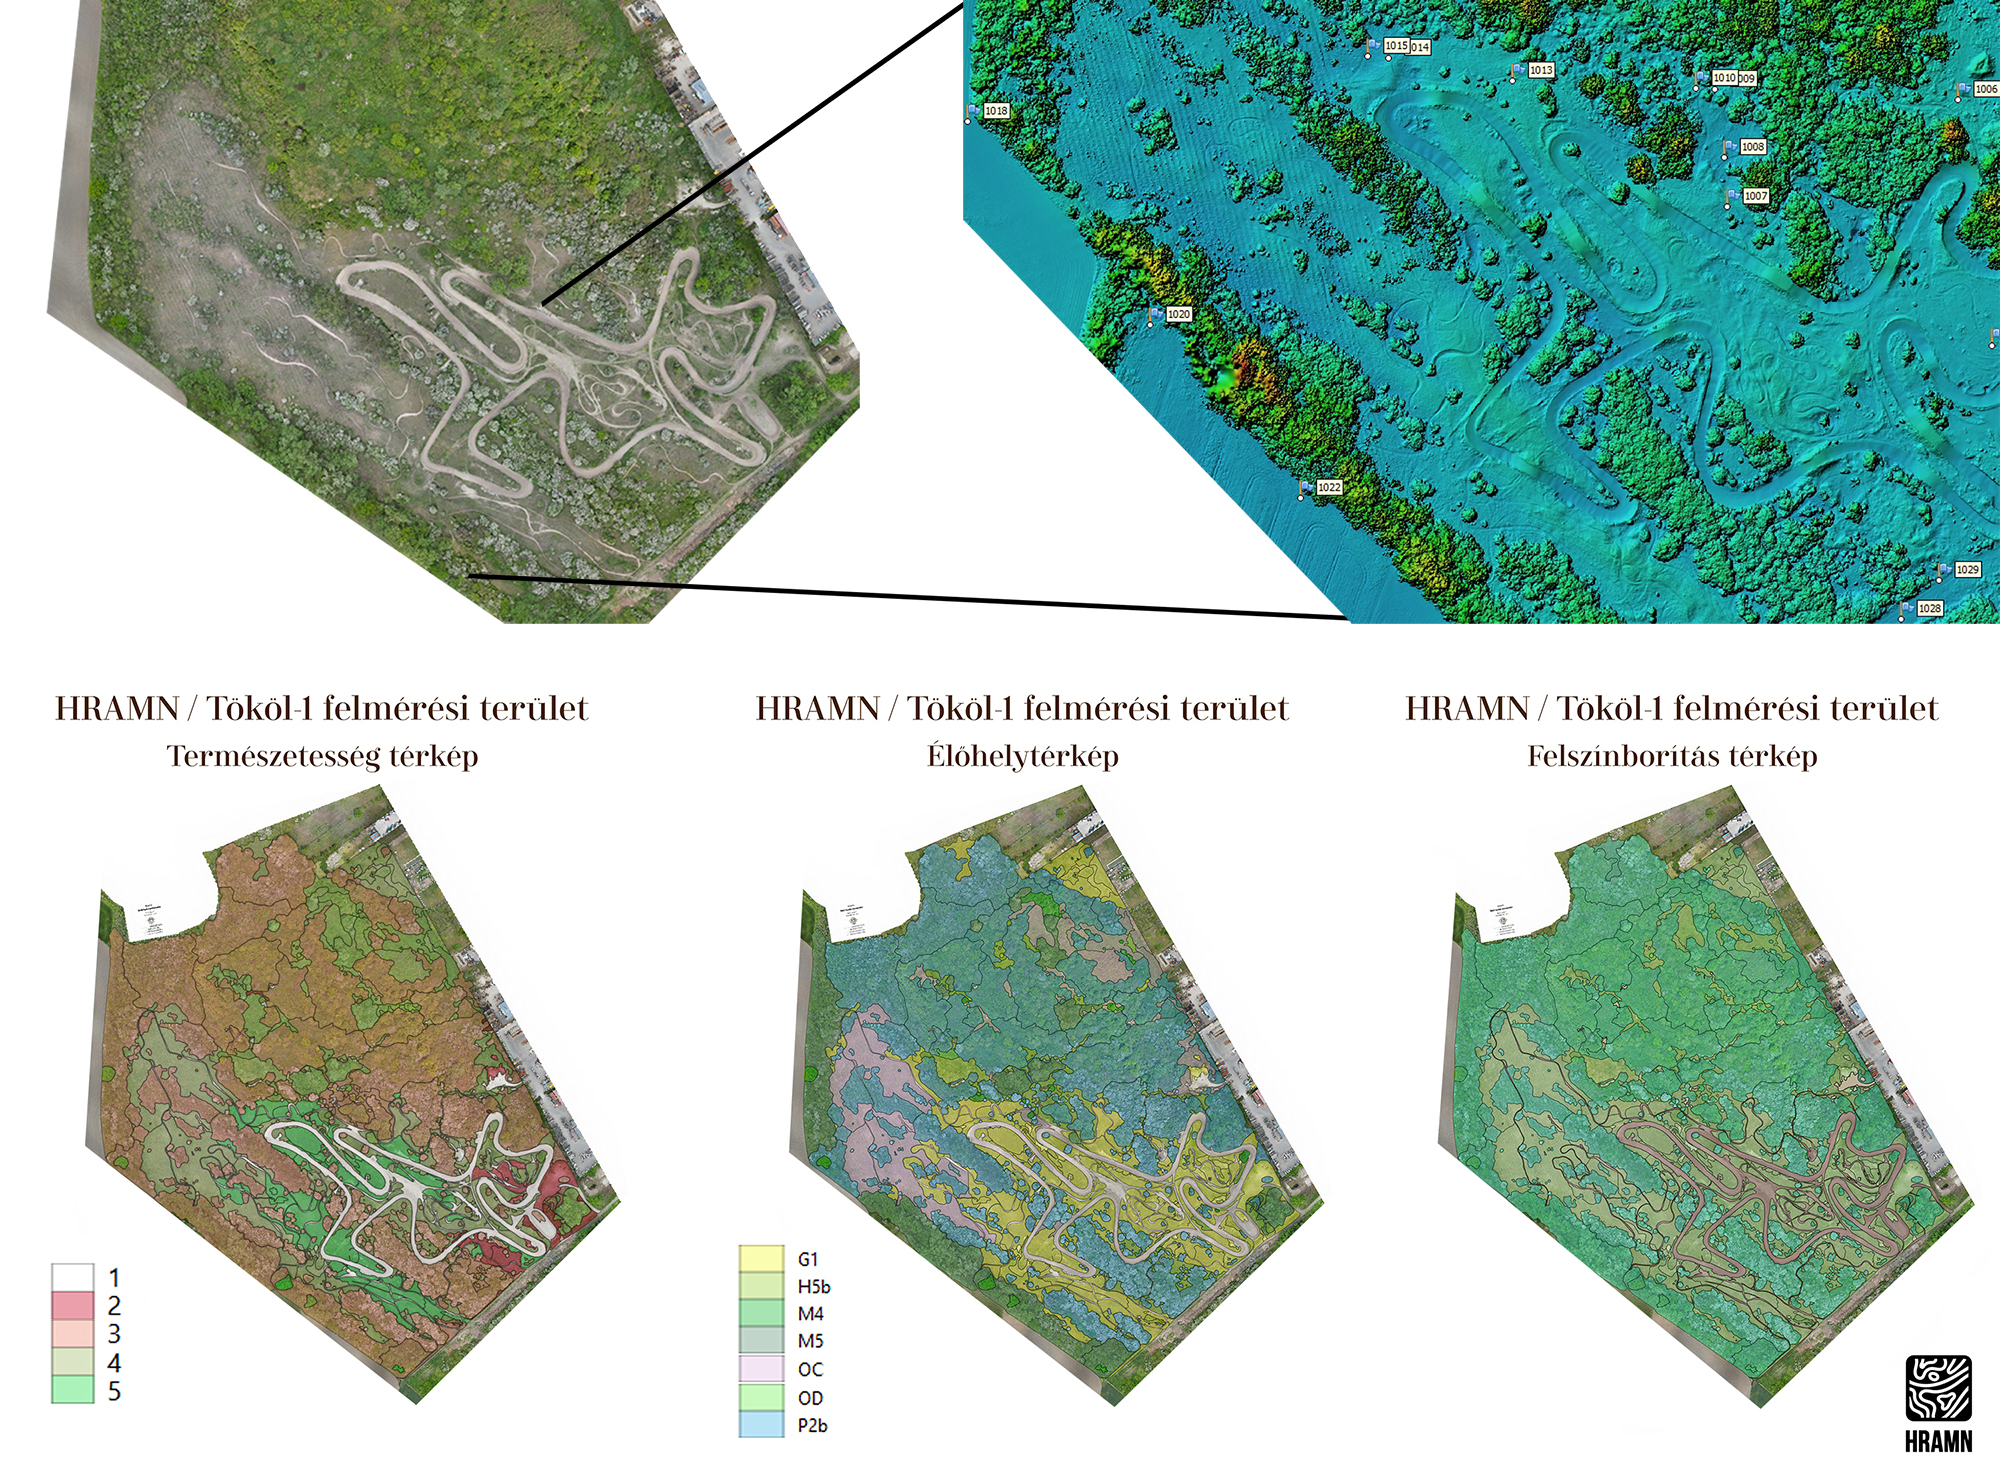
A vectorised spatial database is built from imagery produced within HRAMN. Every geometric element is interpreted through several attribute systems, so the same map network can simultaneously serve as a land-cover, habitat, soil, or landscape-value map (Figure 6). This structure allows a given point or shape to appear on different target maps without having to create separate geometric storage for each map type, but its real advantage emerges when the data are interpreted.
The structure formed in this way creates a machine-learning-compatible data model in which any attribute can be queried through unified geometric identifiers, making GIS processing automatable and robust. This increases efficiency and reduces redundancy, enabling, for example, continuous monitoring of habitat change or the effectiveness of management interventions.
Bakó G. 2013: Nagysebességű repülőgépes távérzékelés és hozzá kapcsolódó adatfeldolgozási módszerek. In: Lóki J. (szerk.) Az elmélet és a gyakorlat találkozása a térinformatikában IV. - Térinformatikai konferencia és szakkiállítás kiadványa, Debrecen. pp. 59–66.
Bakó G. 2013b: Szuperfelbontású ökológiai vizsgálatok. Természettudományi Közlöny 144(10): 477–478.
Bakó, G.; Tolnai, M.; Takács, Á. 2014: Introduction and Testing of a Monitoring and Colony-Mapping Method for Waterbird Populations That Uses High-Speed and Ultra-Detailed Aerial Remote Sensing. Sensors 2014, 14, 12828-12846.
Bakó, G.; Molnár, Z.; Szilágyi, Z.; Biró, C.; Morvai, E.; Ábrám, Ö.; Molnár, A. Accurate Non-Disturbance Population Survey Method of Nesting Colonies in the Reedbed with Georeferenced Aerial Imagery. Sensors 2020, 20, 2601.
Bakó G. 2014: Geoinformációs rendszerek és a távérzékelés szerepe a döntés előkészítésben In: Jeney L. - Hideg É. - Tózsa I. (szerk.) (2014): Jövőföldrajz. A hazai gazdasági fejlődés területi és települési aspektusai a jelenben és a jövőben. Budapest: Budapesti Corvinus Egyetem Gazdaságföldrajz és Jövőkutatás Tanszék - Belügyminisztérium Önkormányzati Államtitkárság közös kiadványa. p. 87 - 98.
Bakó G. (2014): Légi fényképezés a gazdálkodásban és a közszolgáltatásban - Arial Photogrammetry in Economy and Public Services - E-Government Tanulmányok XL. - tankönyv Budapest: Corvinus Egyetem. 126 p.
Bakó G., Kovács G., Molnár ZS., Kirisics J., Góber E., Ambrus A. (2015): The development of a red-mud-flood environmental information system and the methodology for the spatial analysis of the degraded area, Acta Geographica Debrecina Landscape and Environment - Volume 9, Issue 1, 2015.
Bakó G. 2015: Az özönnövények feltérképezése a beavatkozás megtervezéséhez és precíziós kivitelezéséhez In: CSISZÁR Á., KORDA M. (szerk.) (2015): Rosalia kézikönyvek 3 Budapest: Duna–Ipoly Nemzeti Park Igazgatóság. p. 17-25.
Bakó G. 2017: Környezet- és természetvédelmi vonatkozású változások nyomon követése nagyfelbontású légi távérzékeléssel. Doktori (PhD) disszertáció, Szent István Egyetem, Biológia Tudományi Doktori Iskola, Gödöllő. p. 176.
Bakó G. 2018: Önkormányzati technológiák, térinformatika, légi-felvételek, légi-felmérés, (KÖFOP-2.1.2-VEKOP-15-2016-00001 A jó kormányzást megalapozó közszolgálat-fejlesztés” elnevezésű kiemelt projekt keretén belül) Új Magyar Közigazgatás 2018. szeptember
Bakó G., Molnár Zs., Stefán F., Fehér L., Takács N., Kiss N., Demény K., Káplár L., Halászi R. (2019): Nagyléptékű ökoszisztéma szolgáltatás térképezés a Hármashatár-hegyen az NRMH alkalmazásával IV. Fenntartható fejlődés a Kárpát medencében" konferencia "Gyepek biodiverzitása a Kárpát medencében absztraktkötet, Hódmezővásárhely, 2019. december 4.
History of the network:Molnár Zs., Góber E. (2020): Repülőgépes adatgyűjtés a fenntartható jövőért, Természettudományi közlöny, 2020. február pp. 66-69.
| Device | Sensor size | DR (EV) | Source |
|---|---|---|---|
| DJI Mini 3 Pro | 1/1.3" CMOS | 10.20 | CineD measurement, estimate |
| DJI Mavic 3 | 4/3" CMOS | 9.50 | CineD, ProRes RAW |
| DJI Phantom 4 Pro V2 | 1" CMOS | 8.00 | DPReview test |
| DJI Zenmuse X5S | Micro 4/3 | 9.00 | CineD test |
| DJI Zenmuse X7 | Super 35 | 10.00 | CineD + DJI data |
| Nikon D3X | Full Frame | 13.70 | DxOMark data |
| Nikon D850 | Full Frame | 14.80 | DPReview |
| Nikon Z8 | Full Frame | 14.50 | DPReview |
| Canon 5DS | Full Frame | 13.50 | DPReview |
| Canon EOS R5 | Full Frame | 13.80 | JPEG (dpreview) |
| Canon 5D Mark IV | Full Frame | 13.60 | DPReview |
| Sony RX100 VII | 1" CMOS | 11.70 | DPReview |
| Sony A7R V | Full Frame | 15.20 | DPReview |
| Sony A1 | Full Frame | 15.00 | DPReview |
| Panasonic GH6 | Micro 4/3 | 12.50 | (dpreview, CineD) |
| Phase One iXA | Large format | 15.20 | (dpreview, CineD) |
| Modern metric cameras | Micro 4/3 | 15.20 | (dpreview, CineD) |